Apartment Price Map v3 |
November 20th, 2026 |
| boston, rent, tech |
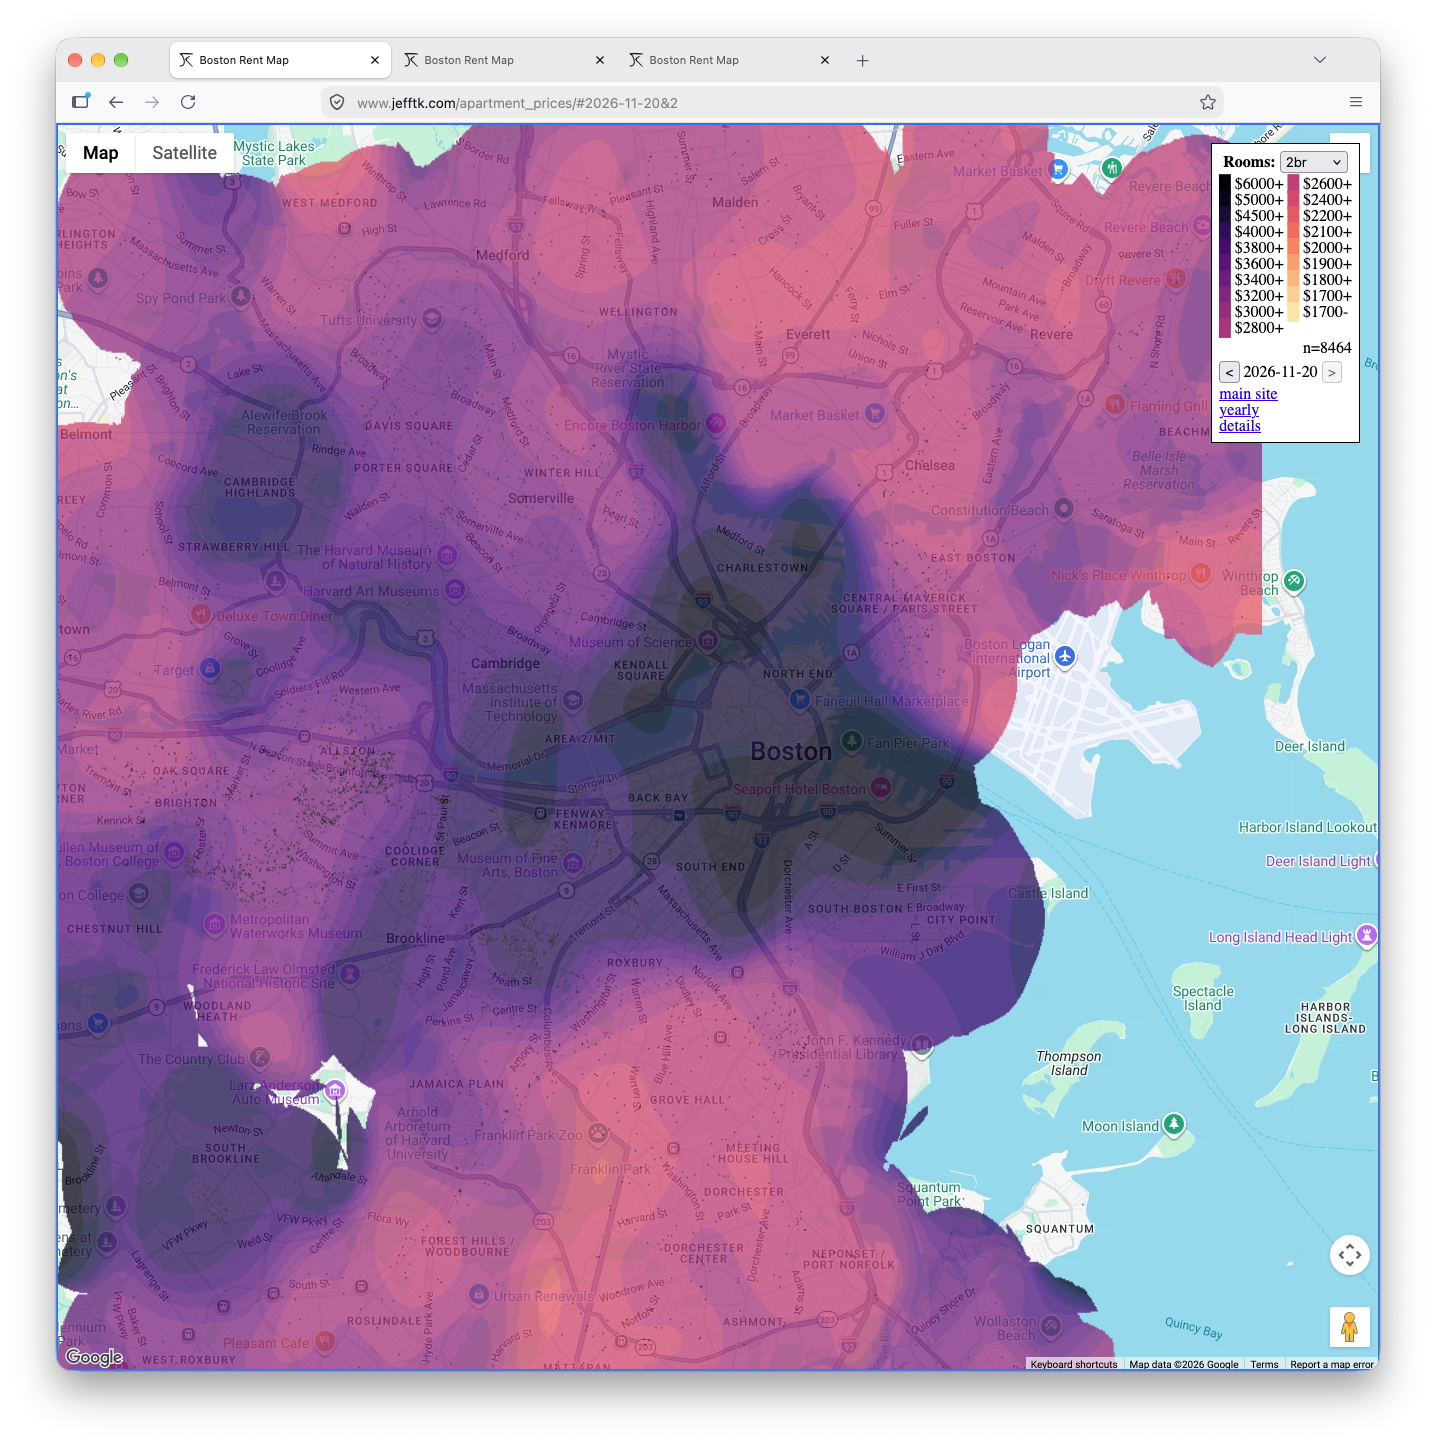
Still, the map has been kind of janky in a bunch of ways: it computed distance in lat-lng space and so weighted north-south higher than east-west, didn't make intelligent use of history, didn't do holdouts correctly, and used a hacky "affine + correction factor" model, among other things. I had Opus 5.5 take a go at cleaning it up, and it's a lot better. The big things:
It found a bug where I had been calculating the legend wrong for years. For example, for 2026-11 this made studios show up as 26% cheaper than they should have, and 3br units 12% too expensive.
Since desirability typically doesn't change quickly, it can combine data across months to make better predictions. This also means we can count each listing only when it first appears: otherwise when overpriced stick around they push modeled prices up.
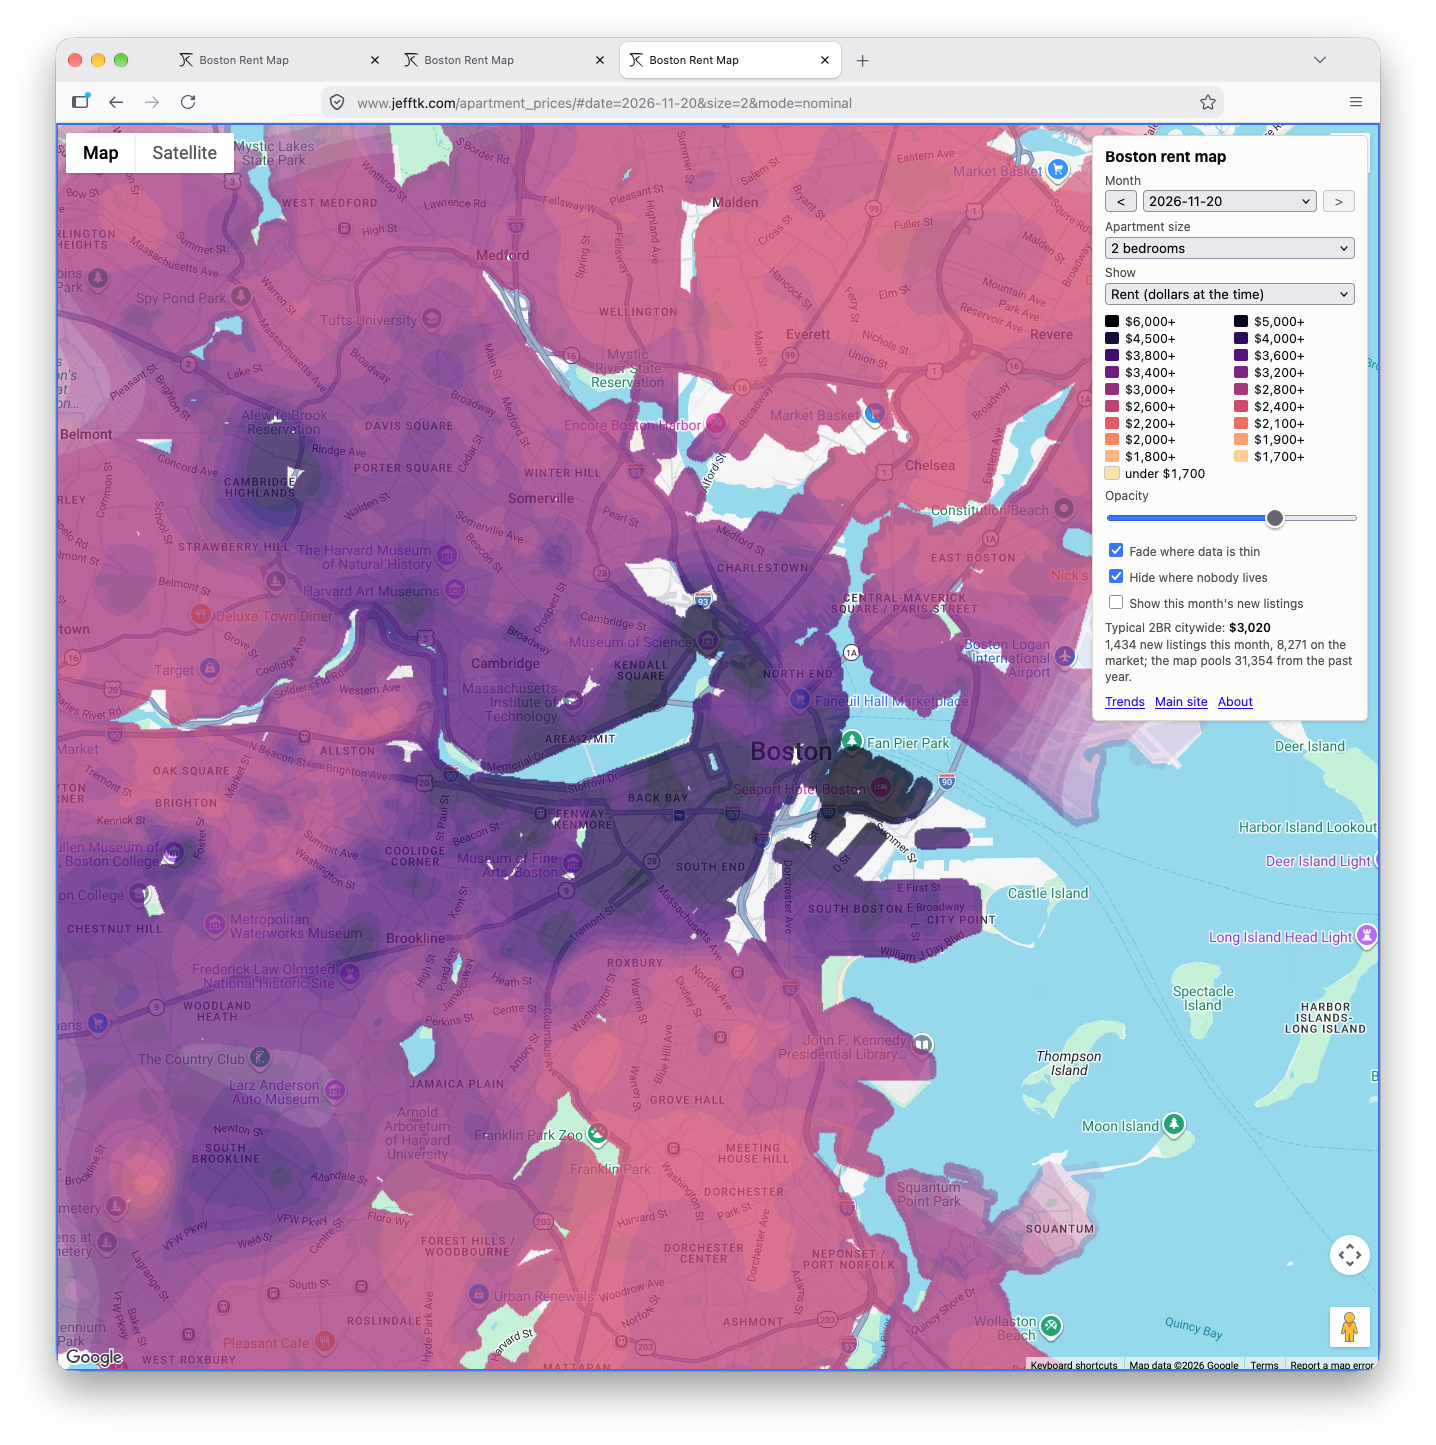
It gives finer detail in areas with more listings, and handles big buildings sensibly.
Several new map views, including inflation adjustment, comparisons across time, and comparisons across space.
A trends page, which has automatically-updated versions of the numbers I used to run in some of my "let's look at this data" blog posts.
It uses Census data to skip places no one lives, instead of claiming rents for the airport or middle of the Charles.
It also runs 270x faster (16s for a month instead of 72min).
Before:
After:
Give it a try: interactive map.
Comment via: facebook, mastodon