Solar Production Data |
May 19th, 2021 |
| power, preparedness, solar, tech |
Our system is a bit weird. We have 14 panels, rated for 360W each. Most of them (11 of 14) are mounted on our 11:12 slope roof, facing WNW (~293°). Since we're in the Northern hemisphere this is a pretty silly direction to point panels, but our neighbors to the ESE have an enormous tree so this is the only direction sun hits our roof. They are considering cutting their tree down, since it's is interfering with their foundation, at which point I might want to put panels on the opposite side of our roof. This means this post likely generalizes even less than my usual ones, but it is at least likely a worst case.
Our system is connected to a monitoring service. While their UI is good for getting rough understanding of performance, it isn't set up to make the charts I'm interested in. It can export data, but at the highest resolution you can only do one day at a time. I automated this, and now I have data for 2018-11-13 to 2021-05-15 at one minute resolution.
Looking it over, there were twelve periods when our system was shut down due to arc faults. Since these have now been fixed by a firmware update I've excluded those periods.
The very highest value in the data is 5273W, 113% of nominal, at 16:04 on 2020-05-09:
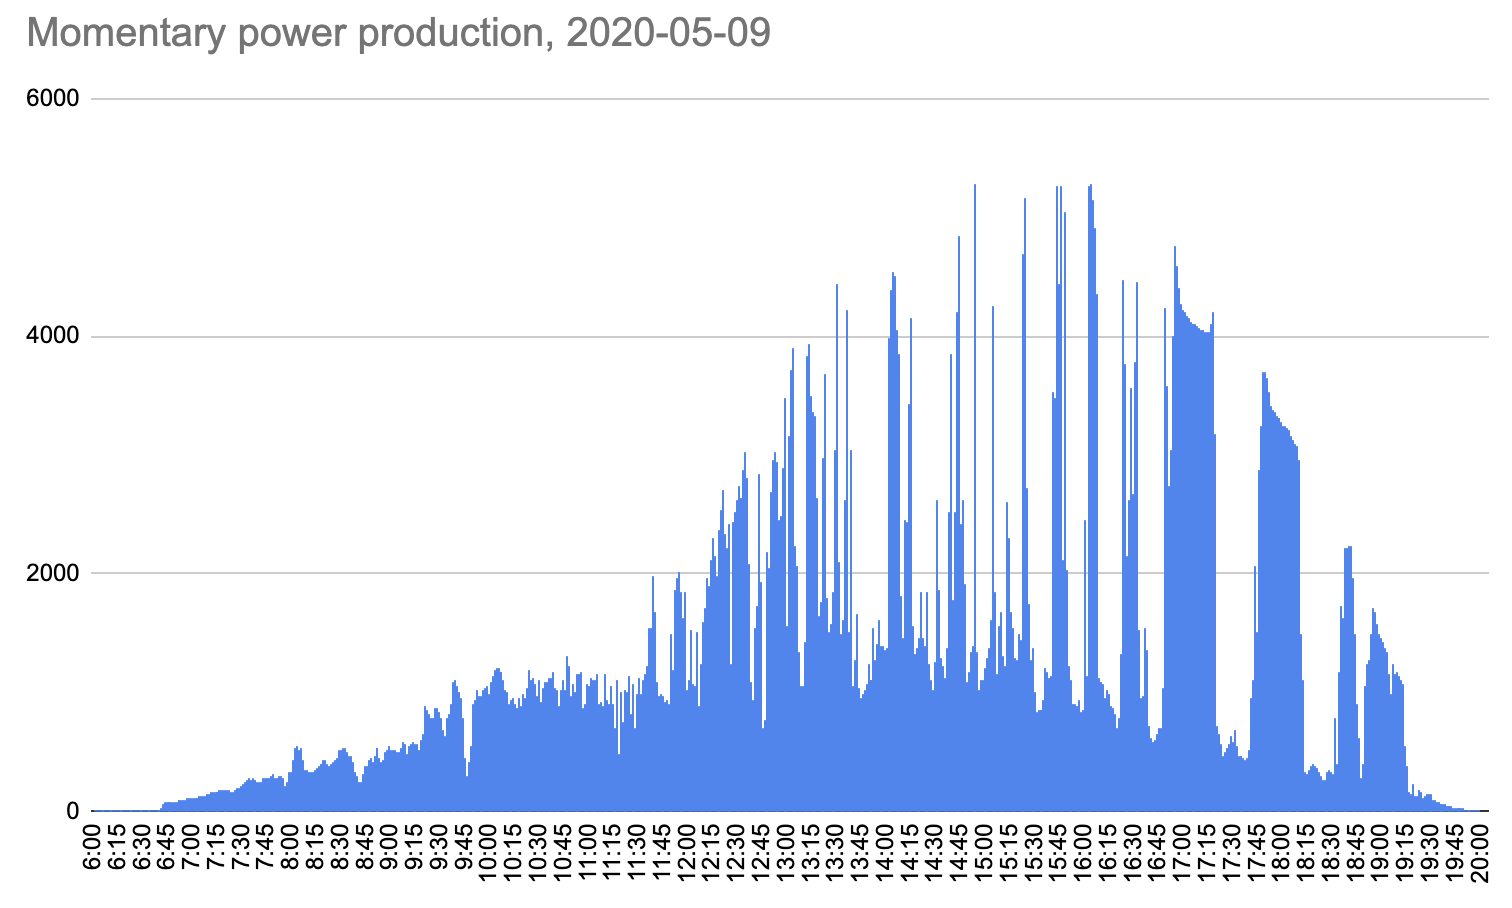
I think this is probably not an error; this was a historically cold day (ideal for production). My guess is we were seeing an edge-of-cloud effect, where the "silver lining" of a cloud can magnify sunlight above what you'd get in direct sun.
Let's take all the minutes in the data, and sort them by production, lowest to highest:
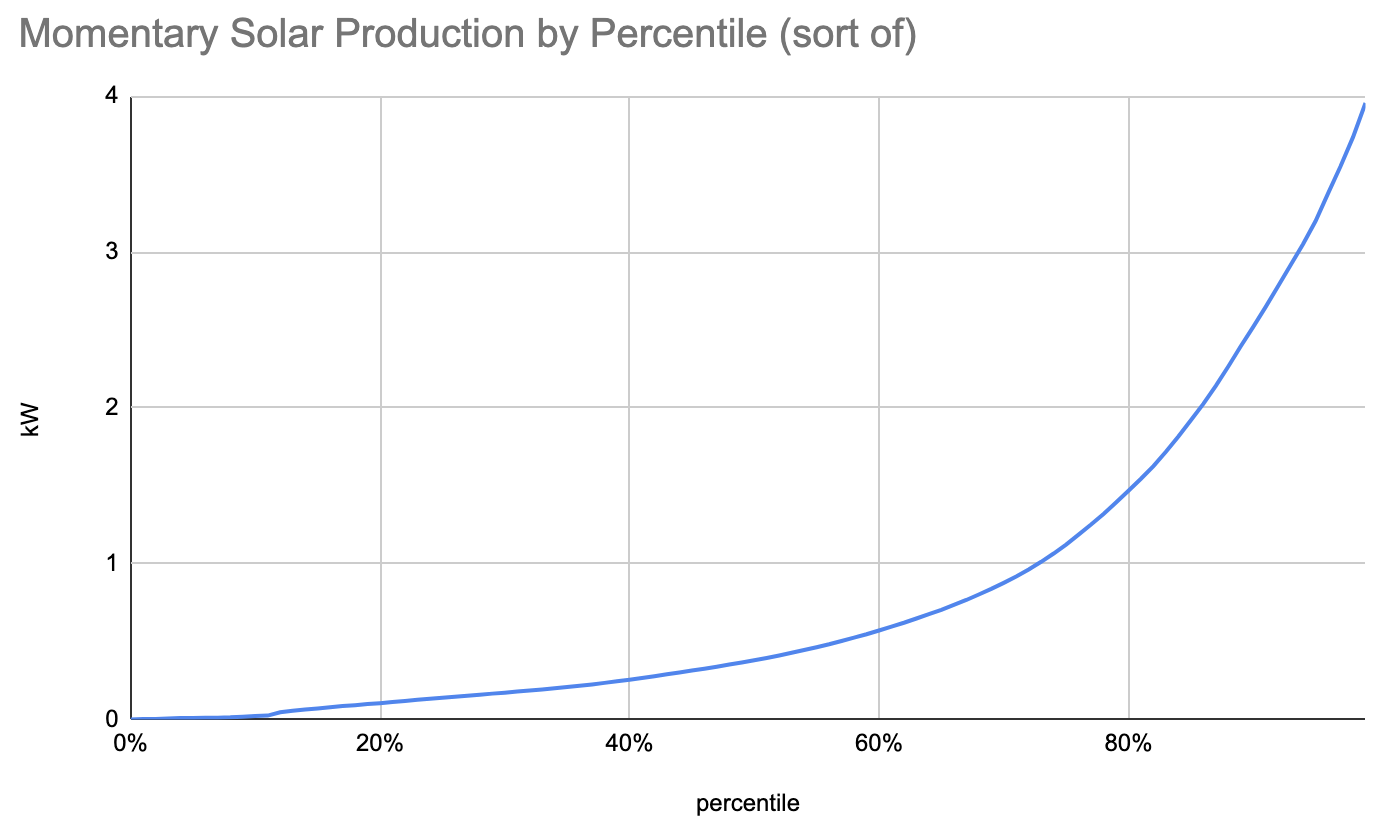
This is a mildly tricky chart, because the raw data does not include times when the system is producing no power at all, such as the night. So it is saying, "if the system is producing power, how much power is it producing."
Perhaps a more useful way to look at this, is by day:
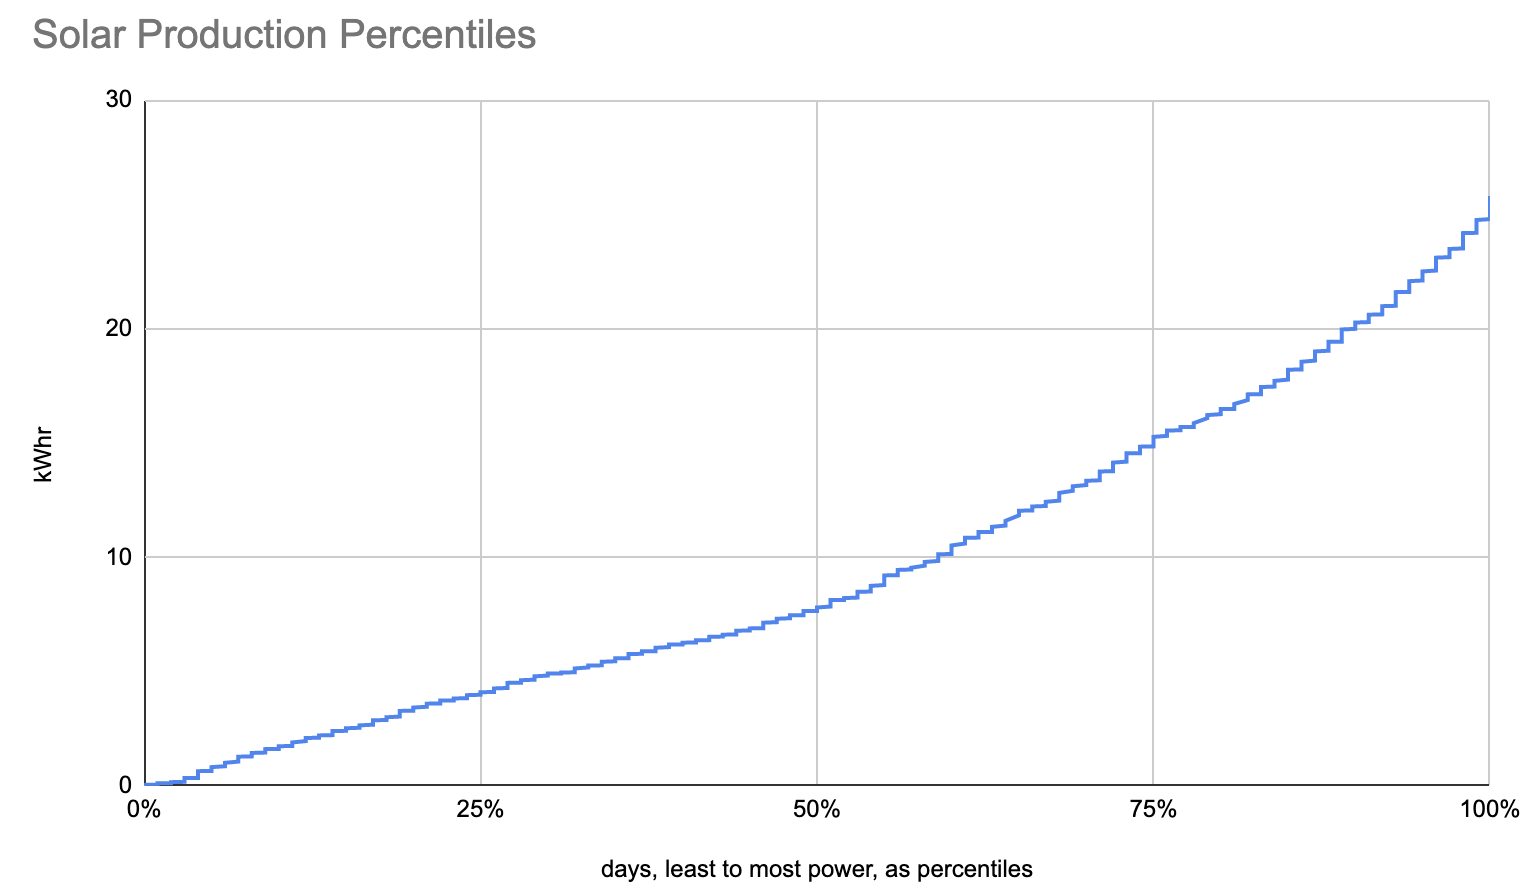
This is the same chart, but instead of aggregating at the "minute" level we are aggregating at the "day" level. You could read this and conclude that a median amount of power is 7.8kW/day, but sunlight varies a lot over the year, and so does production:
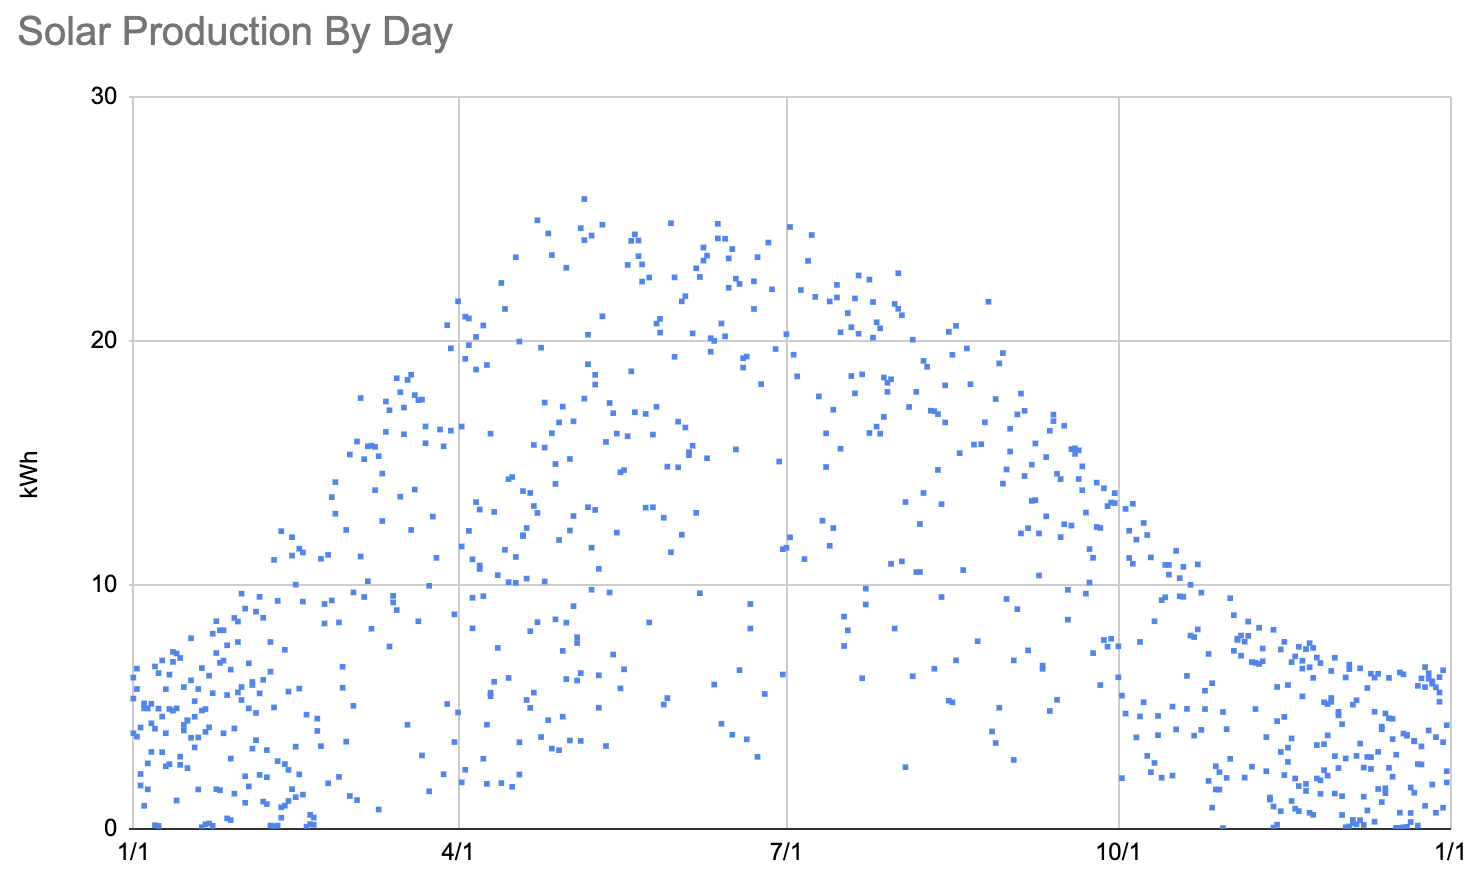
The sunniest days of the summer yield ~25kW while the sunniest days of winter are closer to ~7kW. Sunrise to sunset at the summer solstice here is ~915min, while at the winter solstice it's ~545min. With a summer peak production of ~25kW this would predict a winter peak of ~14kWh, but instead we see just half that. The difference is the angle of the sun: the sun needs to get up pretty far before our panels produce a useful amount of power.
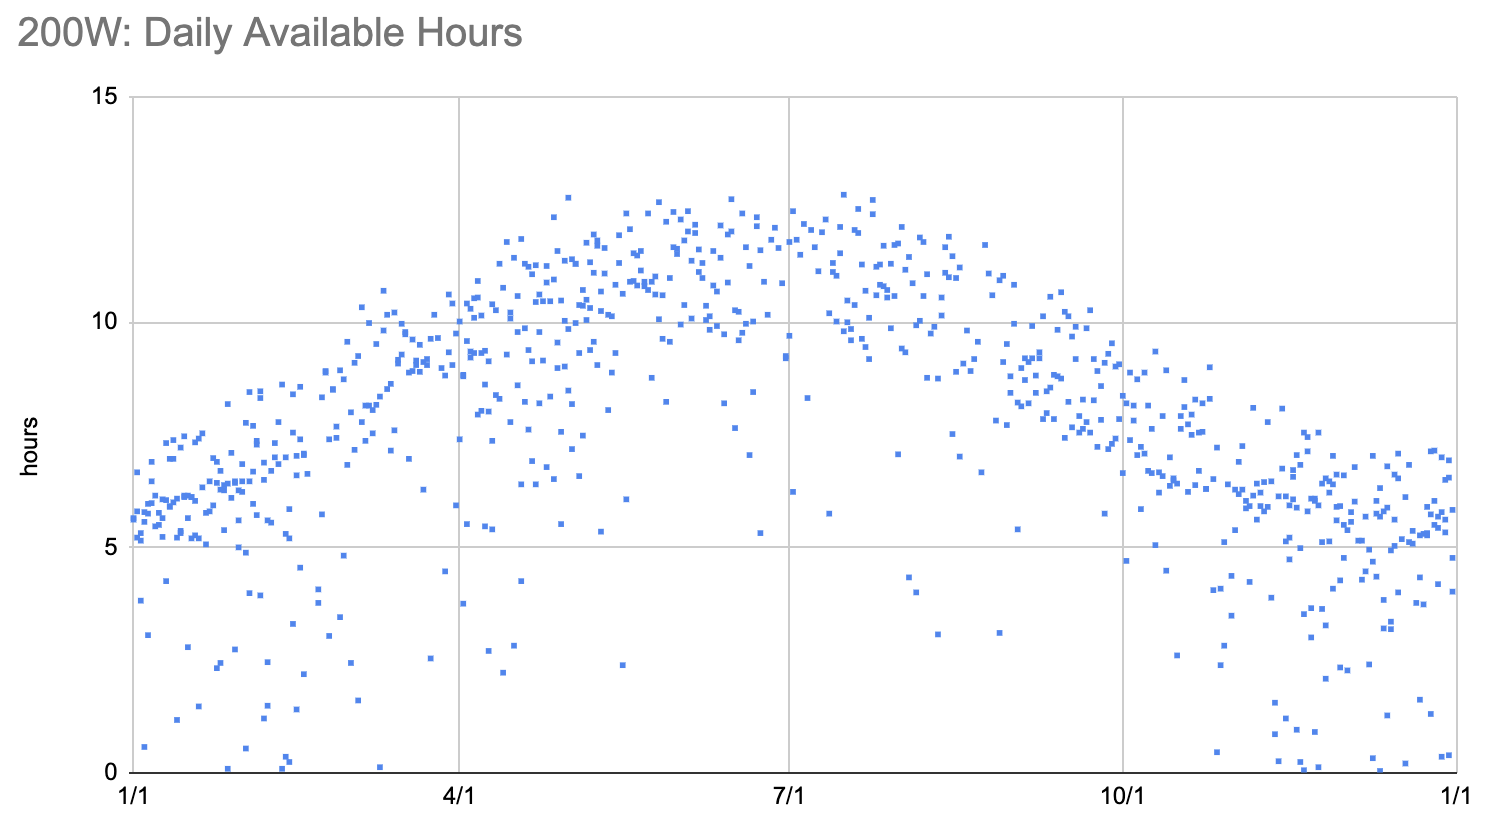
Another way to look at this, though, is about what sort of usage it might support. The SPS produces power on a best-effort basis. If you attempt to draw more than the panels are producing it shuts off and takes a few minutes to reset. Let's model this: if you want to run something that draws some amount of power, for example a sump pump or freezer, how many hours a day would you have enough sunlight to run it?
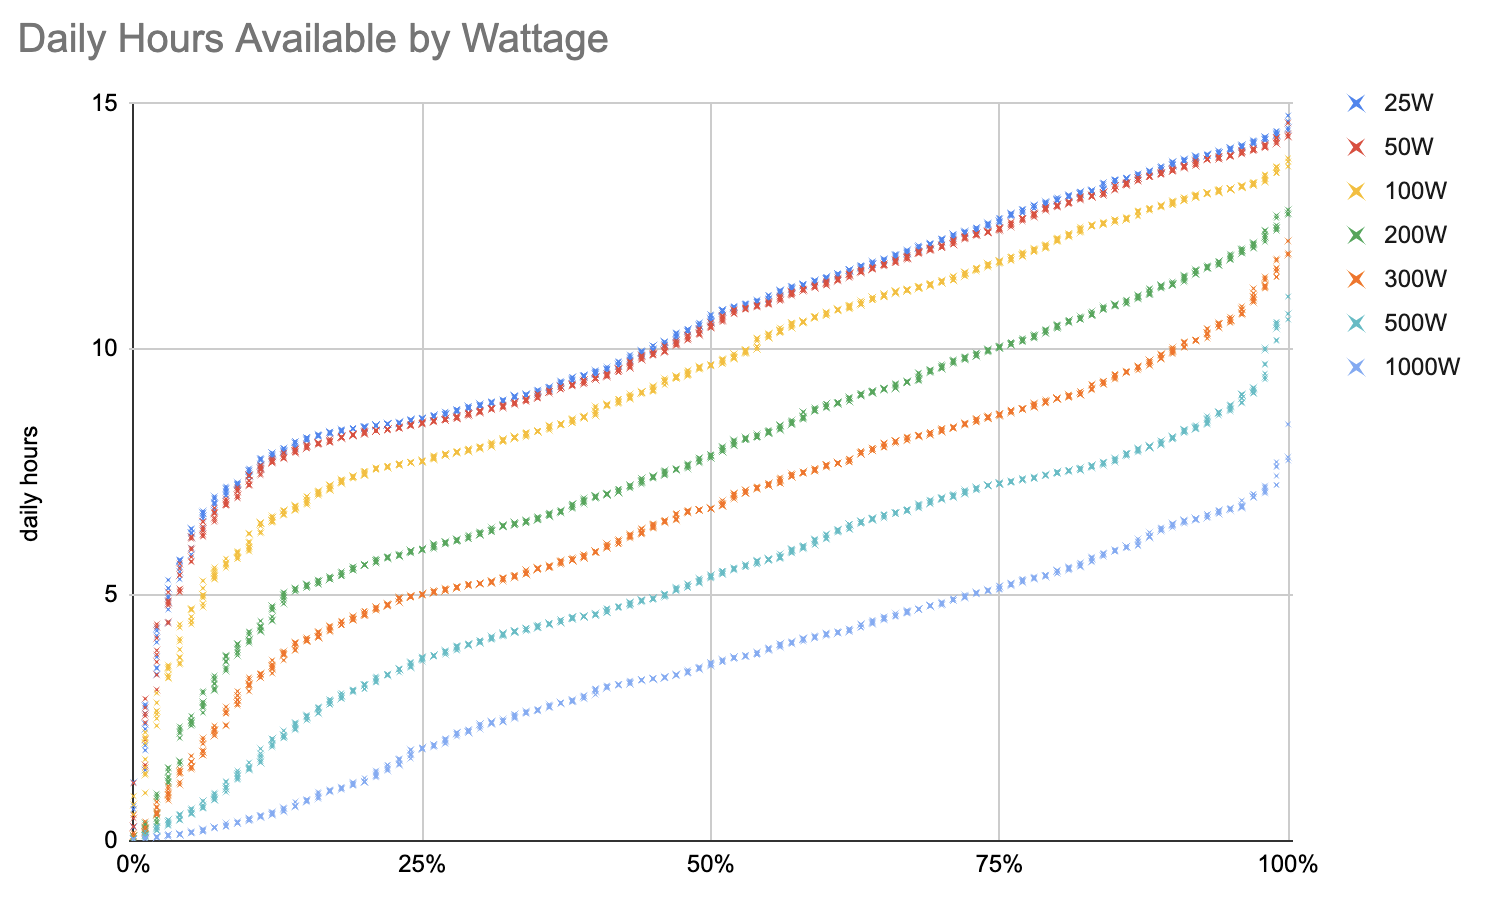
At the top you can see that the lines for 25W and 50W are very close: at such low draws it's almost entirely about whether there is any sun at all. On the other hand, with the lines for higher demands you can see that there is often some sunlight but not enough to power something that needs this much current.
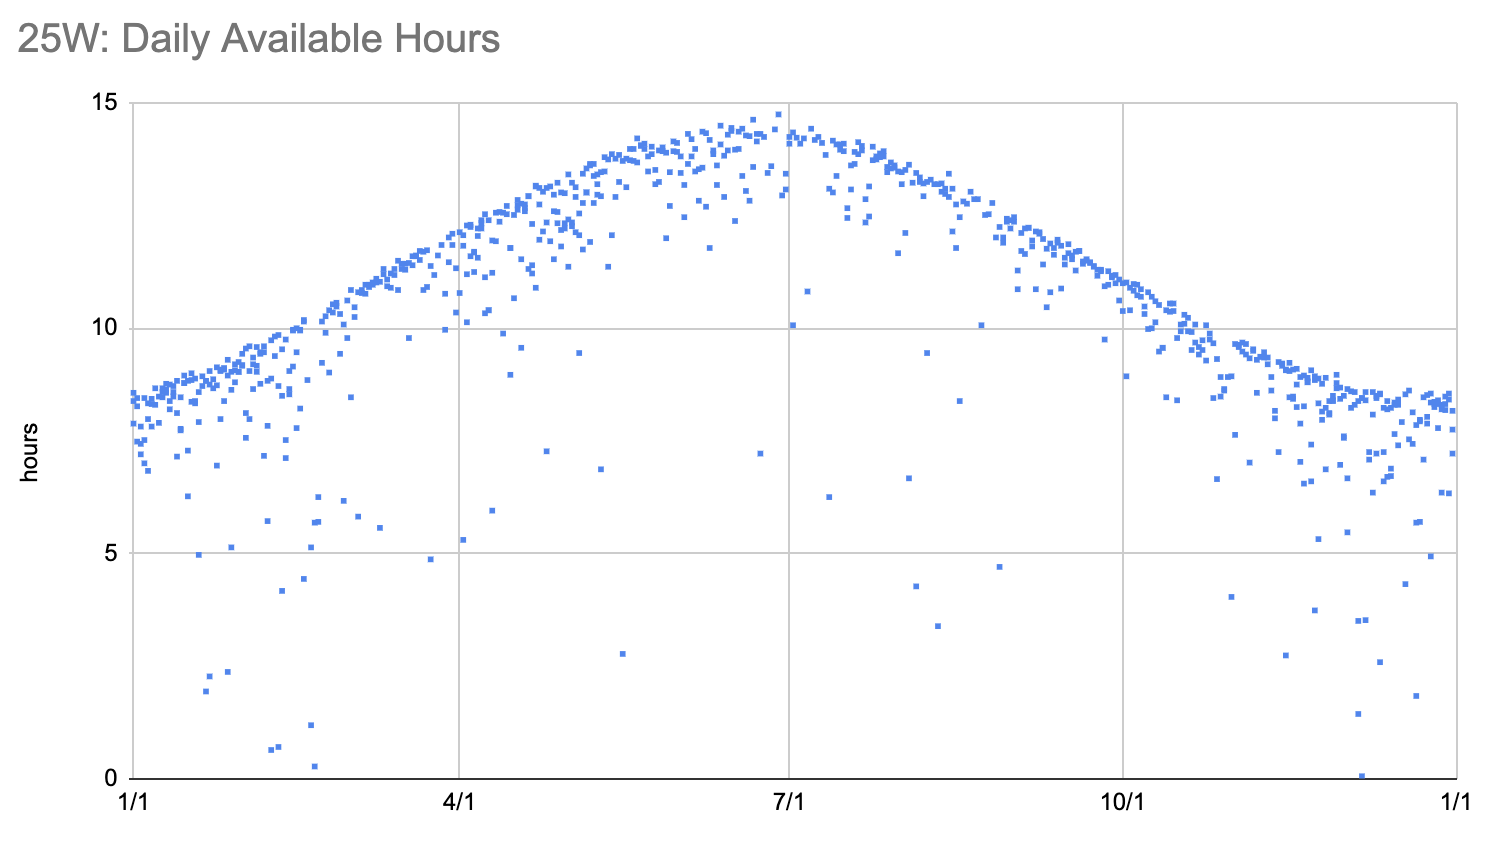
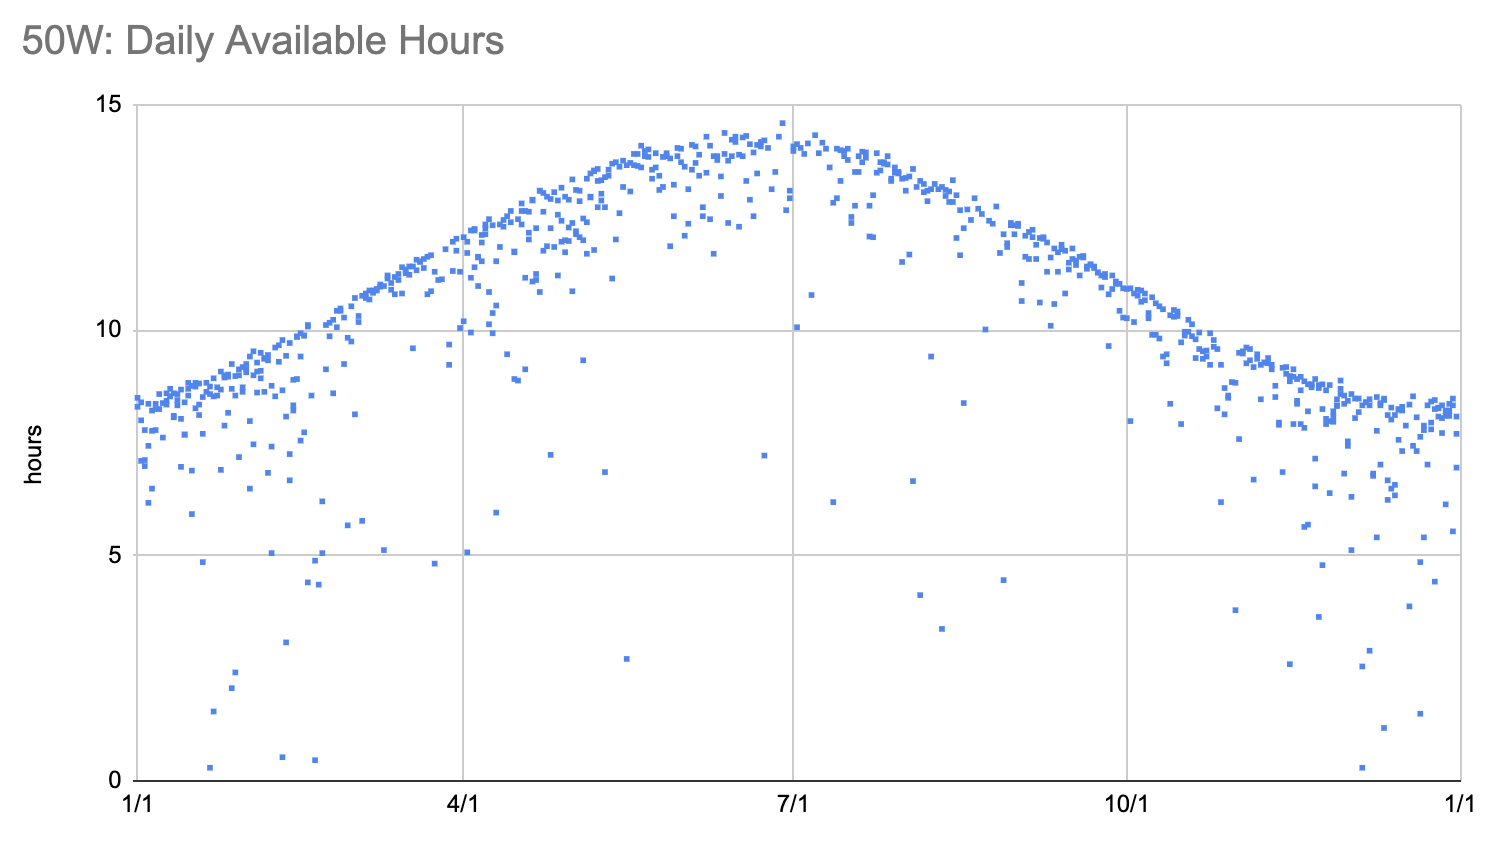
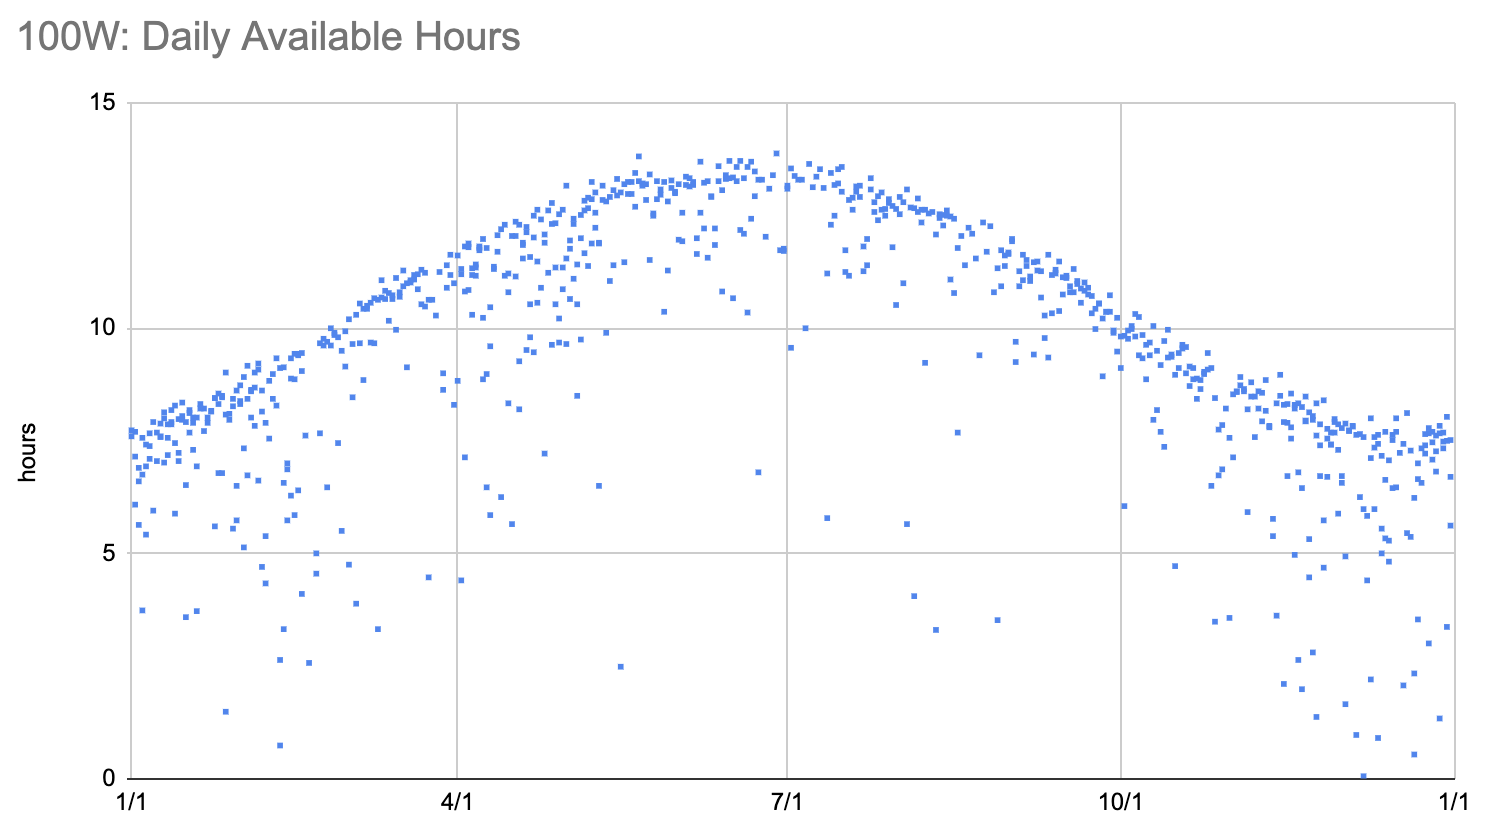
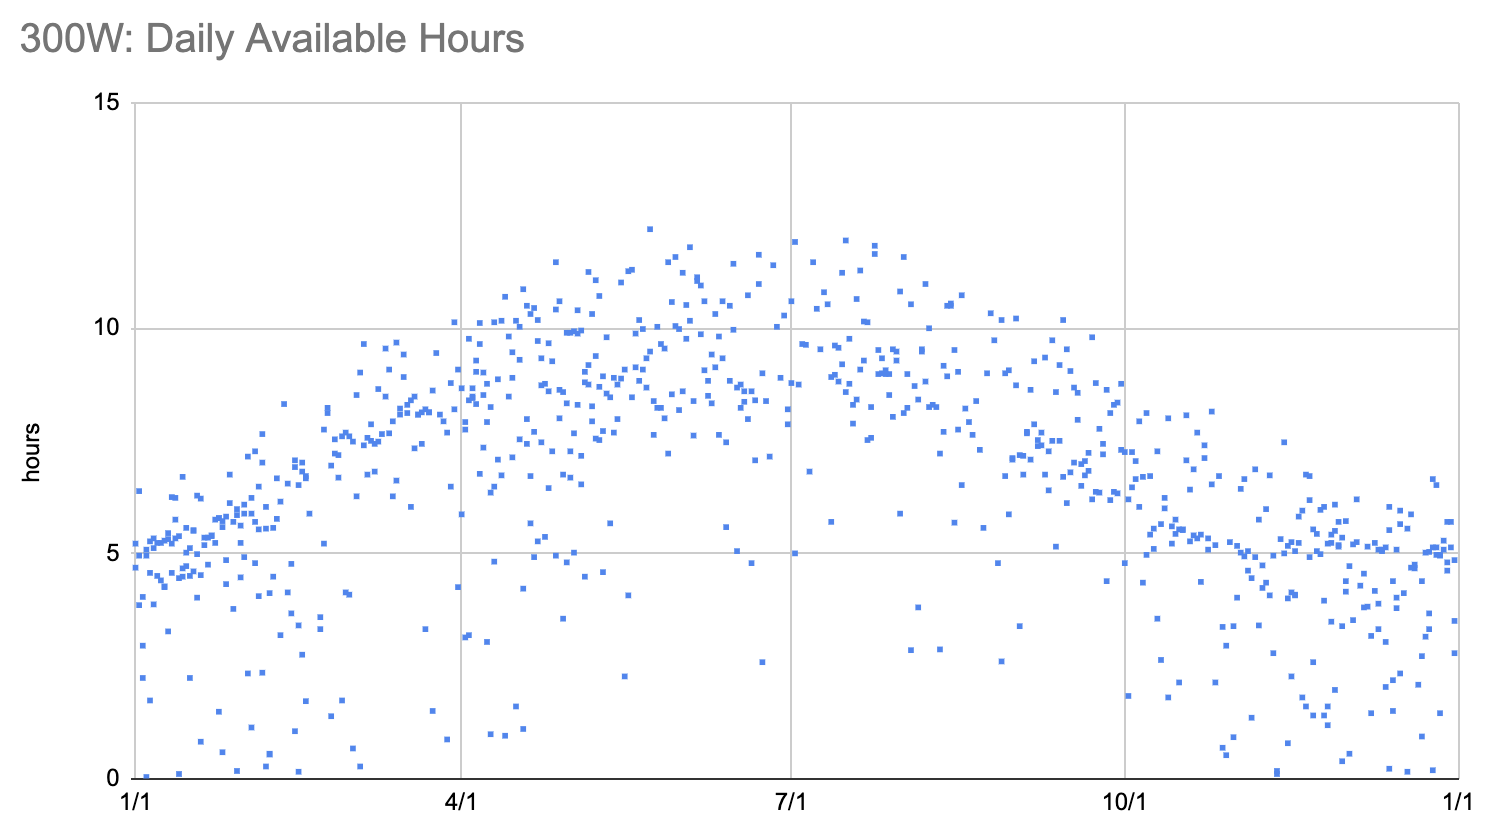
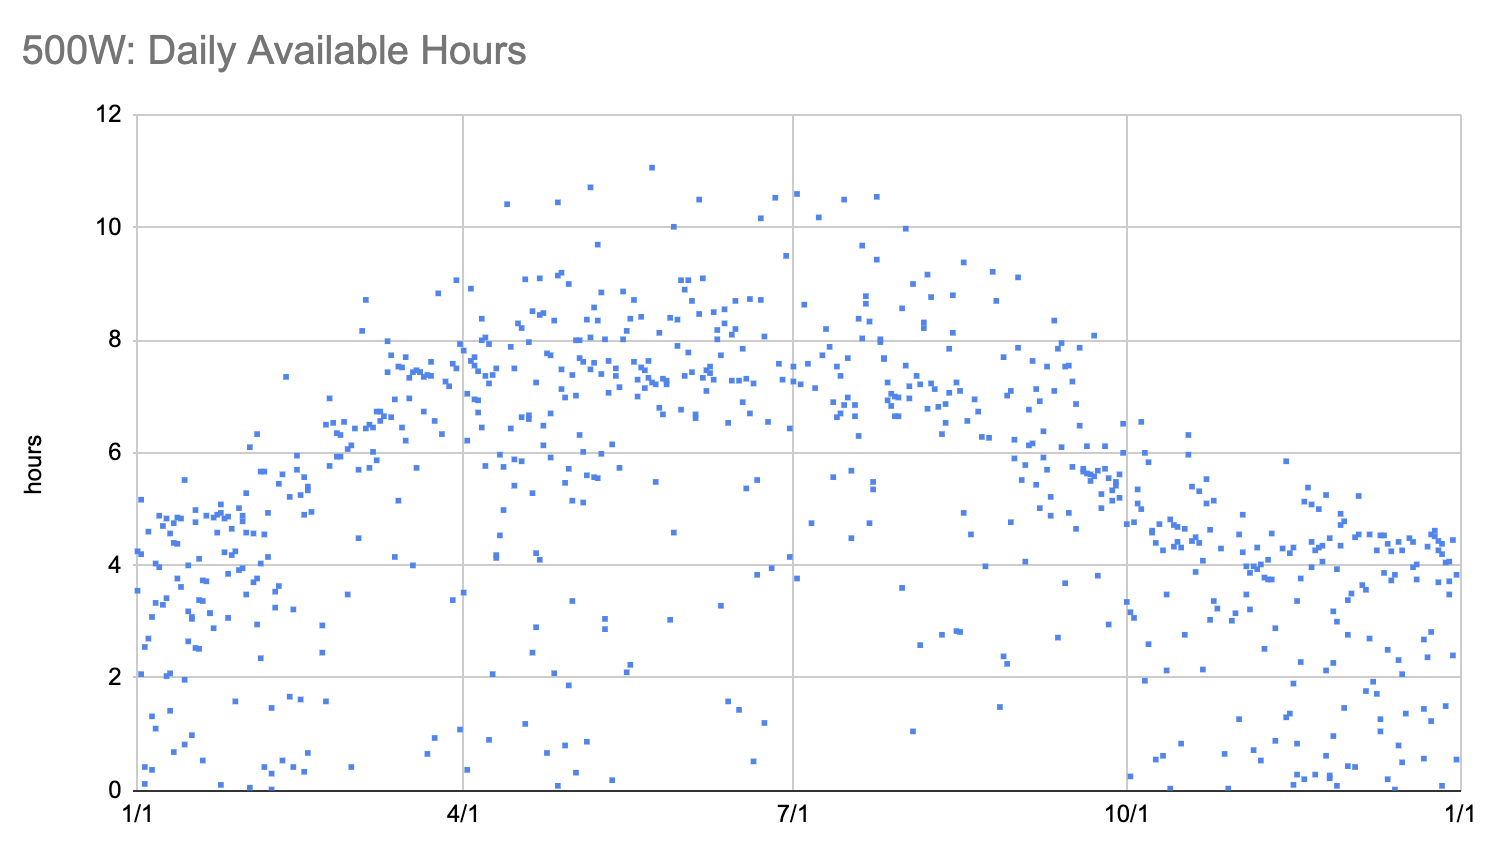
Again, however, it's good to look at this over the course of the year. If I'm thinking about a potential winter blackout, that's pretty different than a summer one. I don't see a good way to get this onto one chart, so here's a bunch:
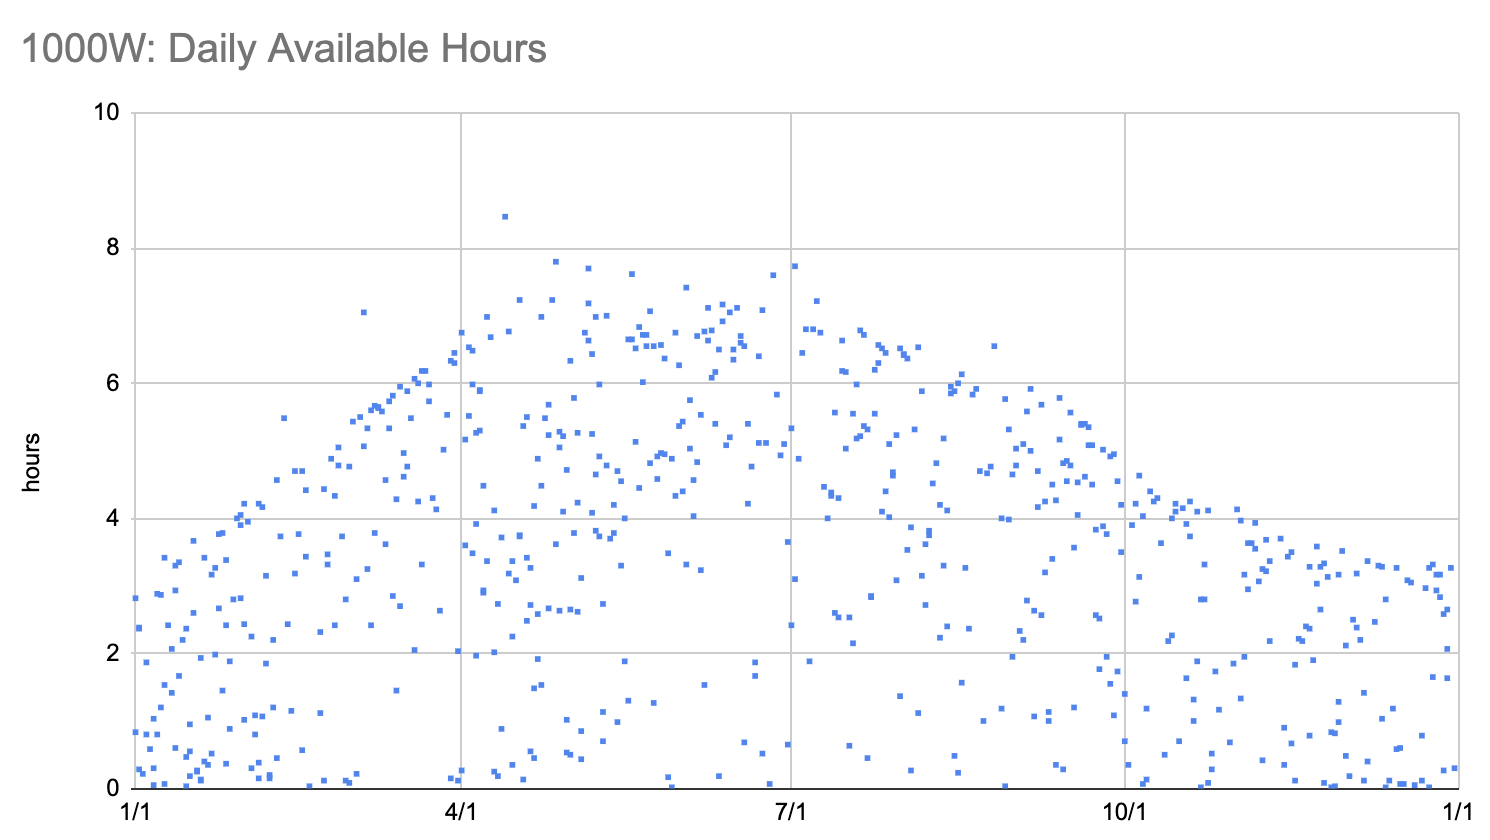
(All code is on github)
The biggest issue for reliability is snow. If I look at the days with the lowest production, they're all snow storms or the days right after. I wonder if there is a safe way to brush off panels that are three stories up?
Comment via: facebook, lesswrong, substack