Estimating Norovirus Prevalence |
May 6th, 2023 |
| bio, nao |
How many people currently have Norovirus? What about in June 2021, to pick a historical month? How could we get an estimate?
The CDC says there are 19-21M cases annually but Norovirus is strongly seasonal; you're much more likely to get it in the winter than the summer. How much more likely?
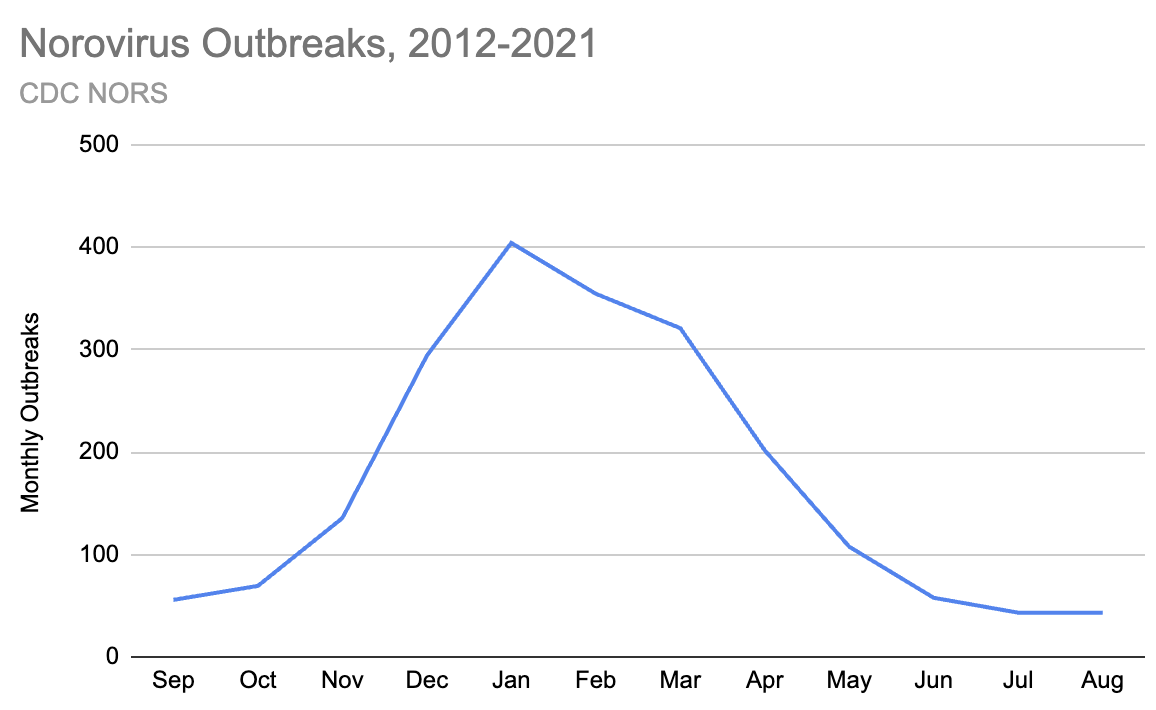
The CDC tracks Norovirus and other outbreaks through the National Outbreak Reporting System (NORS) and you can download the full data through 2021. Since 2012 I see 36,341 outbreaks, of which 20,876 (57%) were classified as Norovirus. Categorizing those by month, and plotting with winter in the middle, we can see January has 10x the outbreaks of August:
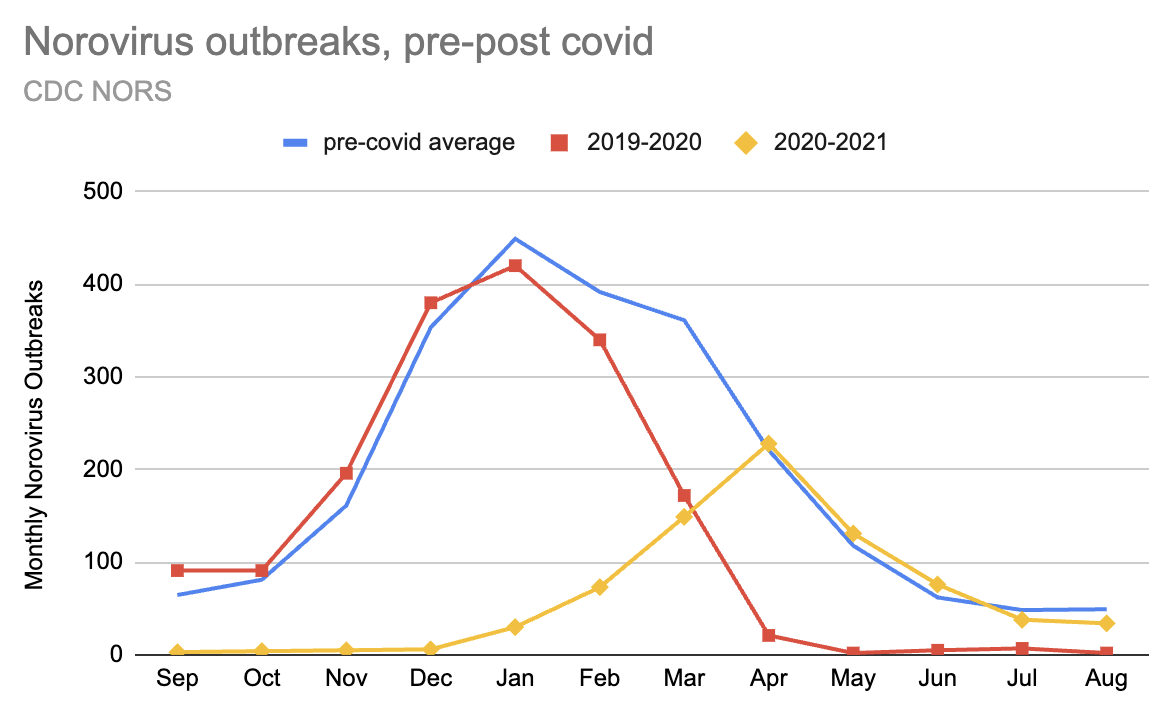
Infections are probably proportional to outbreaks, so we could get an estimate for each month by weighting by the number of outbreaks. But we should be careful: the CDC overall estimate is pre-covid, and by going through 2021 we've included a period when Norovirus, like most infectious diseases, was heavily suppressed:
Let's say we want to know the prevalence during, say, June 2021. Not as in what fraction caught it at some point during that month (that would be the incidence) but on any day what fraction of people were currently infected. We'll start by converting the 20M number of annual infections into a per-capita number by dividing by the corresponding population, 299M people [1] to get an annual incidence of 6.7k per 100k (20M / 399M). A Norovirus illness lasts about two days, so this is equivalent to an average prevalence of 37 per 100k (6.7k * 2 / 365). Pre-covid there were an average of 174 outbreaks per month, [2] and in June 2021 there were 76 outbreaks reported, so for June 2021 we can estimate 16 per 100k people (37 per 100k * 76 / 174).
Why do I care how many people have Norovirus? I want to know how a disease's prevalence (how many people currently have it) translates into relative abundance in wastewater sequencing [3] (what fraction of sequencing reads match the pathogen) to be able to answer questions like "how much would it cost to flag a pathogen that sheds into sewage like pathogen X when Y% of people are currently infected". If we have a decent estimate for the number of infected people, we can connect that to the relative abundance we see in sequencing data, and model the connection. Getting an estimate for Norovirus is one step in this process, and since it's a gastrointestinal infection it represents a bit of a "best case" for wastewater monitoring.
There are still some questions around this estimate:
How accurate are outbreaks as a proxy for infections?
Are there biases that change over time in how outbreaks end up in NORS?
How much should we trust the input estimate for how many people get Norovirus annually?
How much do infections vary locally or over short time periods? The more they do, the less well national outbreak counts for a given month predicts prevalence among the people who contributed to a specific municipal wastewater sample.
Overall, though, even getting a sense of the order of magnitude of the prevalence is helpful here, and I'm excited to have an estimate!
This post describes in-progress work at the NAO and covers work from a team. This specific estimate is mostly my work, with help from Simon Grimm.
[1] The CDC number of annual illnesses comes from this 2011
paper (thanks Simon!) and that says it's relative to a population
of 299M.
[2] Since months aren't all the same length this isn't quite right, but it's pretty close. When doing a more detailed estimate for work I adjusted for the number of days in each month.
[3] Specifically, untargeted metagenomic sequencing. Sequence what there is without amplifying for specific known things.
Comment via: facebook, lesswrong, mastodon, substack