Effectiveness: Gaussian? |
August 8th, 2015 |
| ea |
Effective altruists often claim that big efforts to re-evaluate priorities are justified by large differences in the effectiveness of common options. Concretely, MacAskill, following Ord, suggested in his main conference talk that the distribution looks more like a thick-tailed power law than a Gaussian. He didn't present actual data, but one of the other talks there did: Eva Vivalt showed the actual distribution of estimated effects to be close to Gaussian.Hanson is right that one of the key ideas in effective altruism is that the best options are much better than the typical ones, and so it makes sense to really research your options. Toby Ord mentions this in his Taking Charity Seriously talk, I wrote about it here, Ben Todd uses it to argue that most charity fundraisers cause harm; it's pretty central to the discourse. But maybe it's actually Gaussian and we've been reasoning from bad data?But youth movements have long motivated members via exaggerated claims ...
First, what's the difference? We have a range of possible things we could do to improve people's lives. Each one has a benefit, say in DALYs, and each one has a cost, say in thousands of dollars. What does it look like if we line them all up from least benefit per dollar to most? Graphing the DCP2 estimates for global health and nutrition interventions we get the blue line in the chart below:
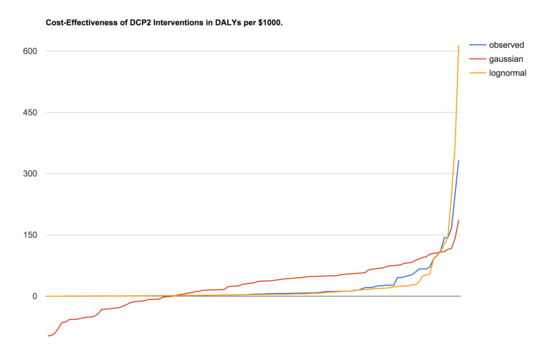
source: Disease Control Priorities Project (DCP2) (csv)
The other two lines are fake data to help show what distributions the observed data most resembles. The red line shows samples from a Gaussian distribution while the orange line samples from a log-normal distribution. [1] The log-normal distribution does seem to be a much better fit than the Gaussian.
So why is Vivalt saying the distribution is Gaussian? She's not. She's making a similar but distinct claim: the effect sizes, in standard deviations, for the interventions AidGrade has RCT data for are normally distributed. These are impacts like "improved stoves on chest pain," "bed nets on malaria," and "deworming on height". If you find that chest pain drops by 0.51 standard deviations for people who receive improved stoves, then this intervention scores 0.51 (more explanation). Do this for all the interventions and effects we've measured and what you see is roughly Gaussian:
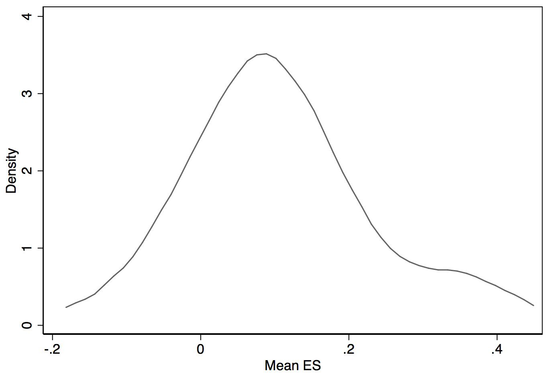
source: comment
posted by Vivalt.
There are reasons not to take this entirely at face value, however. For example, we're including things like "conditional cash transfers on attendance rates" and "microfinance on probability of owning a business" where there's no logical unit size like "one bednet per bed" or "one stove per house". Say one study gives people $10 as an incentive for their kid to attend school while another gives $100. You would expect more money to give a larger effect on attendance rates, but with this methodology we'll just compute the average effect.
It's also likely that researchers are doing some amount of effect-size targeting. Very small effect sizes require large studies to detect, which is expensive, and small effect sizes aren't very interesting anyway because that means the intervention isn't so valuable, so researchers might avoid studies they expect to detect small effects.
Even if effect sizes and everything else involved in an intervention are normally distributed, however, that's still consistent with a log-normal distribution of cost-effectiveness, because when you have many independent things that are all normally distributed their product will be log-normally distributed. Cost effectiveness generally depends on a chain of causality where the links combine multiplicatively. For a worked example of this, see GiveWell's cost-effectiveness estimate for the benefit of bednet distribution (xls). Since when fully broken down these estimates involve multiplying very many sequential effects, it really makes a lot of sense that we'd see a log-normal distribution of bottom-line effectiveness.
So: MacAskill and Ord don't actually disagree with Vivalt, and effective altruists are reasonable to be prioritizing evaluation and measurement.
(But: the data we have is really limited here because the DCP2 numbers aren't very good and reasoning about what we should expect the distribution to look like isn't a very reliable approach.)
[1] The Gaussian distribution was generated from the mean (21.5) and
standard deviation (47.7) of observed data. The log-normal
distribution was chosen to be one whose underlying Gaussian had
the same mean (0.56) and standard deviation (0.93) as the log base
10 of the observed data.
Comment via: google plus, facebook, substack