Dancing vs Performing Over Time |
June 23rd, 2011 |
| calling, dance, graphs, music |
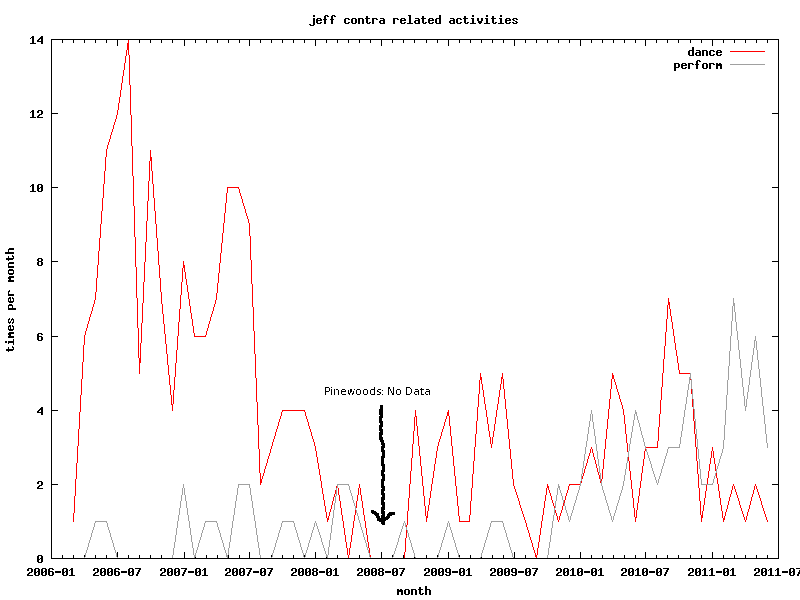
Notes: Performing means calling, playing, or sitting in. From 2008-06-03 to 2008-09-09 I was working at pinewoods, where I did a lot of dancing and not very much performing, but I wasn't recording activities. I hurt my knee in march 2011, and while it is mostly better I've been dancing less. During the school years 2006-2007 and 2007-2008 I was going to swarthmore folkdance class regularly, so it's not on the schedule. I played for one class a week and danced for one class a week (at which I usually called one dance). Those months could be bumped up by 3 in each (on average). Data is from my past. I started keeping that log about three months after getting into dancing, winter break 2005-2006, though I had danced occasionally earlier.
Comment via: facebook, substack