Horizontal Bar Graphs With Labels in Gnuplot

January 10th, 2011
tech
I wanted a horizontal bar graph with labels. Gnuplot doesn't like to make such things, but after a while of searching I figured out 
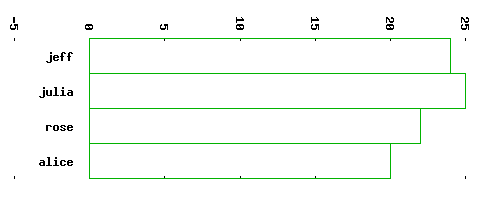
how to convince it to. Data file:
  # index, age, name
  1       24      jeff
  2       25      julia
  3       22      rose
  4       20      alice
  
Gnuplot file:
  set terminal png size "200x200"
  set output 'demo.png'
  set nokey
  unset border
  unset xtics

  plot 'demo.dat' using 1:(-1):3 with labels rotate right, \
       'demo.dat' using 1:2 with boxes
  
Then rotate right in an image editor to get:

Recent posts on blogs I like:

Development RCTs Are Good Actually

In defense of trying things out

via Thing of Things March 25, 2024

Clarendon Postmortem

I posted a postmortem of a community I worked to help build, Clarendon, in Cambridge MA, over at Supernuclear.

via Home March 19, 2024

How web bloat impacts users with slow devices

In 2017, we looked at how web bloat affects users with slow connections. Even in the U.S., many users didn't have broadband speeds, making much of the web difficult to use. It's still the case that many users don't have broadband speeds, both …

via Posts on March 16, 2024

more     (via openring)