BIDA Compensation at Various Funding Levels |
December 14th, 2016 |
| bida, contra, money |
Here are the expenses for a representative dance with normal expenses, one caller, and three musicians:
| Hall | $450 |
| Performers | $400 |
| Sound | $75 |
| Insurance | $30 |
| Other | $20 |
| Total | $975 |
|---|
This tells us that $975 is the break-even point. If BIDA takes in less than that we still pay our performers their $100/each, and BIDA loses money for the evening. If we make more than that BIDA keeps the first $100 in profit, and then any profit over $100 is split in equal shares among the performers and BIDA.
On average we have about 122 paying dancers, plus some volunteers. Then we break even at an average contribution of $8. What happens if we get more or less than that? Our sliding scale is currently $5-$12, so let's look at the whole range:
| contribution | pay per person | bida profit/loss |
|---|---|---|
| $5 | $100 | -$365 |
| $6 | $100 | -$243 |
| $7 | $100 | -$121 |
| $8 | $100 | $1 |
| $9 | $105 | $105 |
| $10 | $129 | $129 |
| $11 | $153 | $153 |
| $12 | $178 | $178 |
Or, as a chart, with the average contribution ($7.87 [1]) shown as a vertical line:
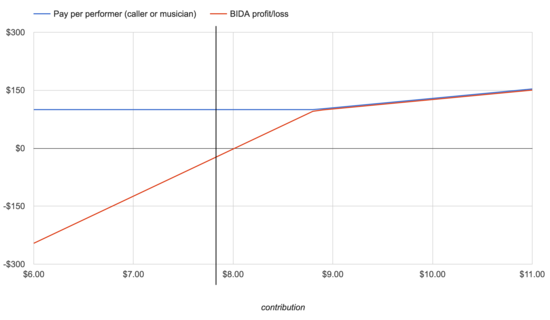
(BIDA "profit" doesn't actually go anywhere, since we're a nonprofit. Instead all the money eventually ends up covering something, generally losses from dances that have low attendance.)
This means when people are generous at the door, BIDA can afford to cover its expenses and pay its performers well. Here's a histogram of average contributions:
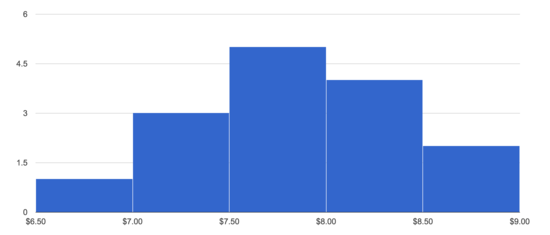
(I would love to show a histogram of contributions here, showing how people interpret the $5-$12 sliding scale, but collecting that data is a pain for the door volunteers.)
At this rate BIDA loses a little money at each dance, and makes up for it when we have dances that are especially well attended.
What if instead of looking at average contributions we looked at attendance? Let's assume everyone gives the average contribution, and look at a range of attendance numbers:
| attendance | pay per person | bida profit/loss |
|---|---|---|
| 90 | $100 | -$365 |
| 100 | $100 | -$243 |
| 110 | $100 | -$121 |
| 120 | $100 | $1 |
| 130 | $105 | $105 |
| 140 | $129 | $129 |
| 150 | $153 | $153 |
| 160 | $178 | $178 |
Here this is as a chart, with a vertical line at the average paid attendance of 122:
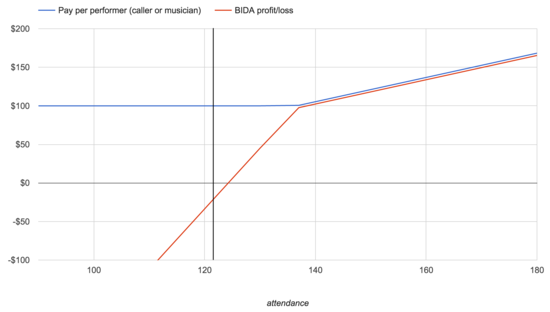
These two charts looks surprisingly similar! They're both saying that right now BIDA typically loses a little bit of money, but if we could get attendance or contributions up by 25% to 152 people or $9.84/person, we could be regularly paying our performers 25% more, or $125. [2]
So: if you would like to help BIDA pay performers better, bring your friends dancing, chip in a little more at the door if you can, or both!
[1] Weirdly, the median is almost exactly the same, at $7.86.
[2] An increase of 25% is the only place these numbers come out so nicely. At lower increases performer pay goes up by a lower percentage, while with a higher increase performer pay would go up by a larger percentage. Here's a table:
| increase in attendance or contributions | increase in performer compensation |
|---|---|
| 5% | 0% |
| 10% | 0% |
| 15% | 6% |
| 20% | 15% |
| 25% | 25% |
| 30% | 35% |
| 35% | 44% |
| 40% | 54% |
| 45% | 63% |
| 50% | 73% |
Comment via: google plus, facebook, substack