Sequencing Swabs |
January 31st, 2024 |
| bio, covid-19, ea, nao, tech |
While this is about an area I work in, I'm speaking for myself and not my organization.
At the Nucleic Acid Observatory we've been mostly looking at metagenomic sequencing of wastewater as a way to identify a potential future 'stealth' pandemic, but this isn't because wastewater is the ideal sample type: sewage is actually really—the joke writes itself. Among other things it's inconsistent, microbially diverse, and the nucleic acids are have degraded a lot. Instead the key advantage of wastewater is how practical it is to get wide coverage. Swabbing the noses and/or throats of everyone in Greater Boston a few times a week would be nuts, but sampling the wastewater gets you 3M people in a single sample. [1]
Imagine, though, that people were enthusiastic about taking samples and giving them to you to sequence. How much better would that be? What does "better" even mean? In Grimm et al. (2023) we operationalized "better" as RAi(1%): what fraction of shotgun metagenomic sequencing reads might come from the pathogen of interest when 1% of people have been infected in the last week. For example, in our re-analysis of Rothman et al. (2021) we found a RAi(1%) of ~1e-7 for SARS-CoV-2, which means we'd estimate that in a week where 1% of people contracted Covid-19, one in 10M sequencing reads would come from the virus. Let's say you were able to get throat swabs instead; what might RAi(1%) look like?
The ideal way to determine this would be to swab a lot of people, run untargeted sequencing, analyze the data, and link it to trustworthy data on how many people were sick. But while public health researchers do broad surveillance, collecting and testing swabs for specific things, as far as I can tell no one has combined this with metagenomic sequencing. [2] Instead, we can get a rough estimate from looking at studies that just sequenced sick people.
In Lu et al. (2021) they ran shotgun metagenomic RNA sequencing on throat swabs from sixteen Covid patients in Wuhan. Patients with higher viral load, and so lower Ct values on their qPCR tests (roughly the number of times you need to double the amount of SARS-CoV-2 in the sample until it's detectable), consistently had higher relative abundance:
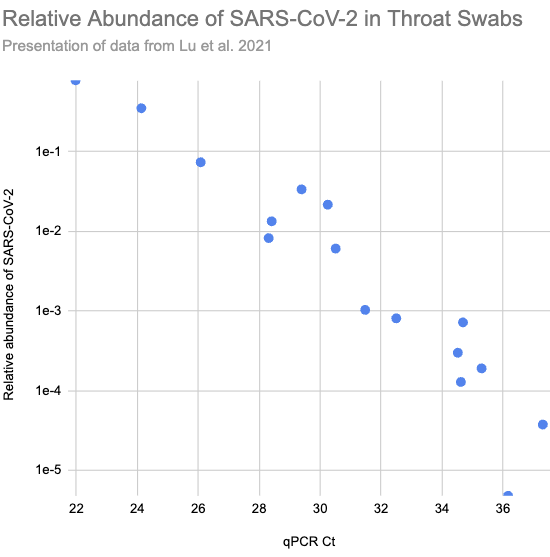
Larger version of Fig 2.a.1, reconstructed from Supplementary Table S1)
Imagine we got swabs from a lot of people, of which 1% were sick. What sort of relative abundances might we get? If we collect only a few swabs it depends a lot on whether we get anyone who's sick, and if we do get a sick person then it matters a lot how high their viral load is. On the other hand, if we collect a very large number of swabs then we'll just get the average across the population. Assuming for the moment that we can model "sick" as "similar to one of those sixteen hospitalized patients", here's a bit of simulating (code):
[EDIT: the y-axis on this chart is 100x too high. For example, the black line should be just below 1e-3]
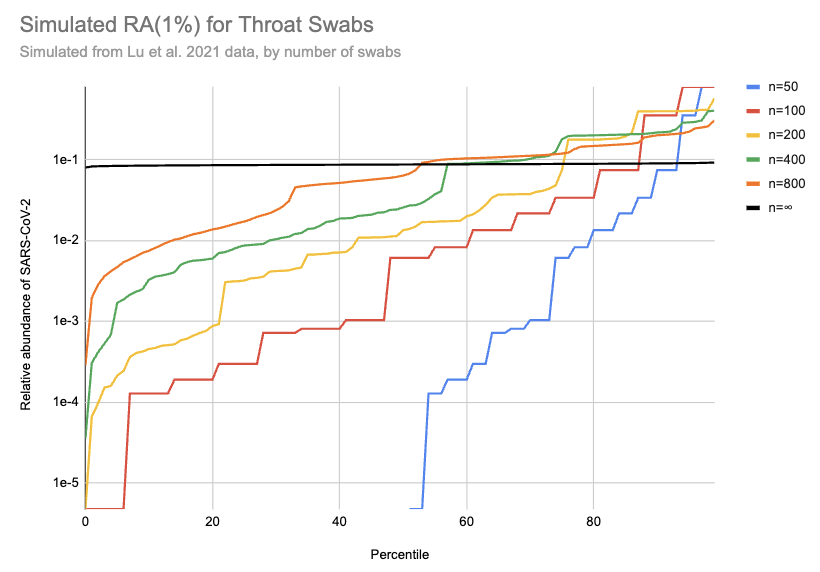
This is 10k simulations, ordered by the relative abundance each gave. For example, if 1% of people are sick and you only swab 50 people then in half the simulations no one in the sample is sick and the relative abundance is 0, which is why the blue n=50 line only shows up for percentiles 50% and above. On the other hand, if we collect a huge number of swabs we end up with pretty consistently 0.08% of sequencing reads coming from SARS-CoV-2. With 200 swabs the median RAi(1%) value is 0.01%.
One major issue with this approach is that the data was collected from hospitalized patients only. Having a high viral load seems like the sort of thing that should make you more likely to be hospitalized, so that should bias Ct values down. On the other hand, people tend to have lower viral loads later in their infections, and hospitalization takes a while, which would bias Ct values up. Here's a chart illustrating this from Knudtzen et al. (2021):
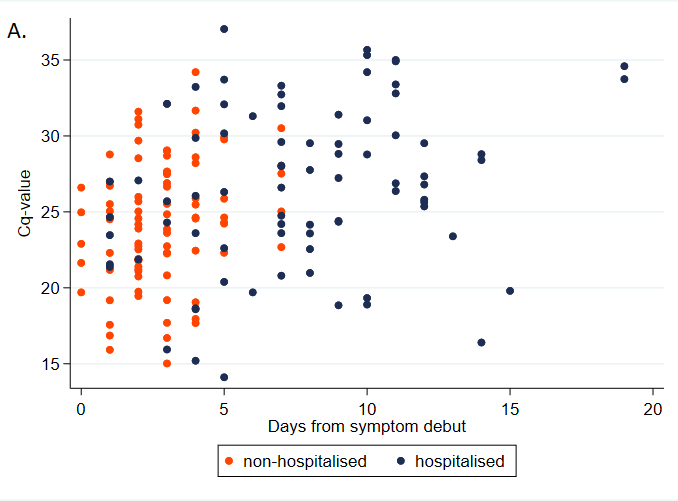 Note that Cq and Ct are different abbreviations for same
thing.
Note that Cq and Ct are different abbreviations for same
thing.
Is there a paper that tells us what sort of Ct values we should expect if we sample a broad swath of infected people?
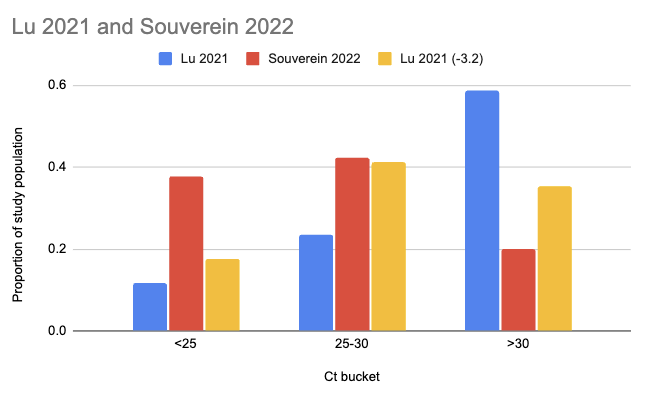
Souverein et al. (2022) looked at a year's worth of SARS-CoV-2 PCR tests from a public health facility in the Netherlands. The good news is these tests averaged two days from symptom onset and they got results from 20,207 people. The bad news is we only have data from people who decided to get tested, which still excludes asymptomatics, and these were combined nasopharyngeal (NP, "deep nose") and oropharyngeal (OP, "throat") swabs instead of just throat swabs. Still, pretty good! Comparing their Ct values to what we see in Lu et al. (2021), it looks like viral loads are generally a lot higher:
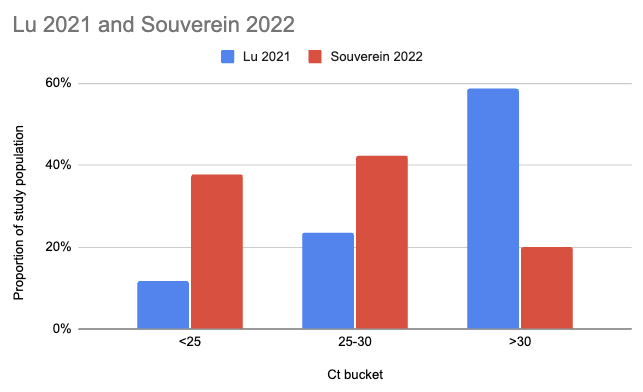
There are two issues with taking this chart literally. One is that the combined swabs in Souverein should generally have given lower Ct scores for the same viral load than throat-only swabs would have given. A quick scan gives me Berenger et al. (2020) where they found a median Ct 3.2 points lower for nasopharyngeal than throat samples, so we could try to adjust for this by assuming the Lu Ct values would have been 3.2 points lower:
The other issue, however, is worse: even though it's common to talk about Ct scores as if they're an absolute measurement of viral load, they're dependent on your testing setup. A sample that would read Ct 25 with the approach taken in one study might read Ct 30 with the approach in another. Comparisons based on Ct within a study don't have this problem, but ones across studies do.
So, what can we do? My best guess currently is that the Lu data gives maybe slightly lower relative abundances than you'd get sampling random people, but it's hard to say. I'm going to be a bit unprincipled here, and stick with the Lu data but drop the 20% of samples with the highest viral loads (3 of 16) to get a conservative estimate of how high a relative abundance we might see with throat swabs. This cuts RAi(1%) by a factor of ten:
[EDIT: the y-axis on this chart is 100x too high. For example, the black line should be just below 1e-4]
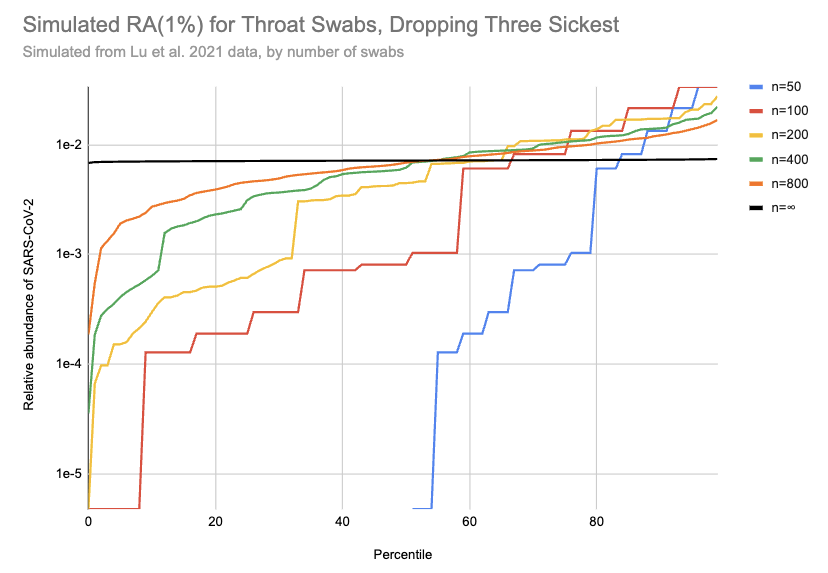
I really don't know if this is enough to where the remaining samples are a good representation of what you'd see with random people in the community, including asymptomatics, but let's go ahead with it. Then with 200 swabs the median RAi(1%) value is now 4e-5, a ~400x higher relative abundance than we see with wastewater. [3] If you could cost-effectively swab a large and diverse group of people, this would allow surveillance with much lower sequencing costs than wastewater. But that's a big "if": swabbing cost goes up in proportion to the number of people, and it's hard to avoid drawing from a correlated subgroup.
Thanks to Simon Grimm for conversations leading to this post and for sending me Lu et al. (2021), to Will Bradshaw for feedback on the draft and pointing me to Knudtzen et al. (2021) and Souverein et al. (2022), and to Mike McLaren for feedback on the draft.
[1] Technically it gets you that in two samples, since Biobot tracks
the North System and South System separately. But you can combine them
if you want simpler logistics.
[2] If you know of someone who has, or who would if they had the money for sequencing, please let me know!
[3] Pathogen identification would also be much easier with swabs, since it's a far simpler microbiome and the nucleic acids should be in much better condition.
Comment via: facebook, facebook, lesswrong, the EA Forum, mastodon