Lyme Disease By County |
July 24th, 2015 |
| lyme, map |
Yesterday people were excited about a map
that was supposed to show risk of catching Lyme by county.
Unfortunately, it actually measured something complex but correlated,
the year in which the county was first designated "high risk". This
is interesting, but I wanted the map I'd hoped to find: annual
per-capita cases of Lyme. So I made it:
(Colors chosen with Color Brewer.)
Referenced in: Peekskill Lyme Incidence
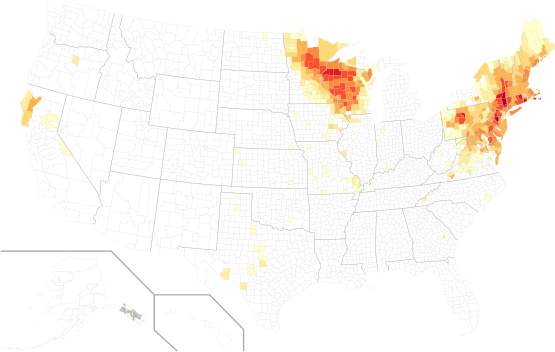
| color | annual risk |
|---|---|
| █ | < 0.002% |
| █ | < 0.004% |
| █ | < 0.009% |
| █ | < 0.017% |
| █ | < 0.034% |
| █ | < 0.068% |
| █ | < 0.137% |
| █ | < 0.274% |
| █ | < 0.548% |
The map is colored by annual "confirmed cases" as reported by the CDC (csv) divided by the Census estimate of the 2012 population (csv) with mild weighting for recency. This isn't quite right, since population hasn't stayed constant over the last 20 years, but it should be pretty close.
If you want to know what the incidence is in a particular county, you
can look it up in lyme_risk_by_county.csv.
Code is on github.
(This 2009 flowing data post was very useful.)
Comment via: google plus, facebook, substack